Three numbers, no flattery
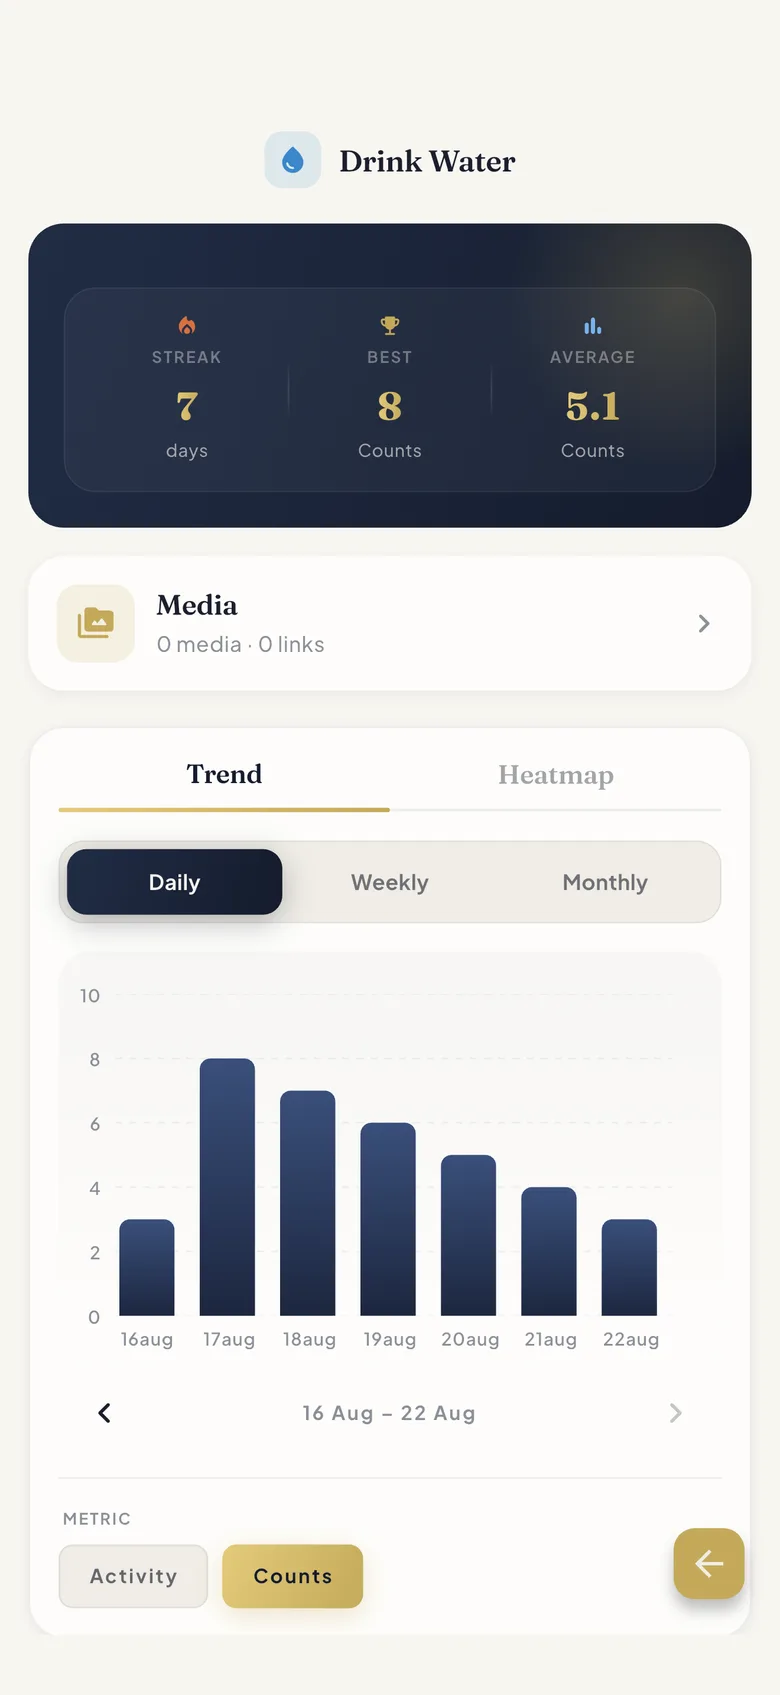
Tap any habit and three stats lead the page: STREAK in days, BEST, and AVERAGE. The average counts only the days you actually logged — honest math, not a number diluted to zero by rest days.
Trends you can drill into
The Trend tab draws Daily, Weekly and Monthly bar charts, and you swipe between periods. Tap any bar to open that period’s logs — the chart is a door, not a picture.
METRIC chips switch every chart between plain activity count and any attribute the habit carries — counts, km, dollars. One habit, several honest views.
Your month, at a glance
The Heatmap tab shades your month by activity, and your rhythm shows up fast — strong weekdays, quiet Sundays, that empty second week. Missed a day? Log it later and the map fills in.
History you can touch
Below the charts sits a Breakdown history — entries per day, week or month, each tappable to edit. And every habit gets a media card: the photos, videos and links you attach to logs, kept where the numbers are.
FAQ
Insights: your questions, answered
How is the average calculated?
Over logged days only. A rest day doesn’t drag your running average toward zero — the number reflects what you actually do when you show up.
Can charts show units instead of counts?
Yes. METRIC chips above the charts switch between plain activity count and any attribute the habit tracks — km, pages, dollars. Every metric gets its own daily, weekly and monthly views.
What does the heatmap show?
One month per screen, shaded by how much you logged each day. It’s the quickest way to spot your rhythm — and any day you missed can still be logged after the fact.
Can I edit an old entry?
Yes. The Breakdown history under each habit lists every period, and each entry is tappable to edit. Back-dating is supported too.
Learn it hands-on
Guides for insights
Try it in the app
Every feature is free for up to 10 habits — no trial, no lock-in, no credit card.